Understand and master your LinkBossPro Biolink page analytics
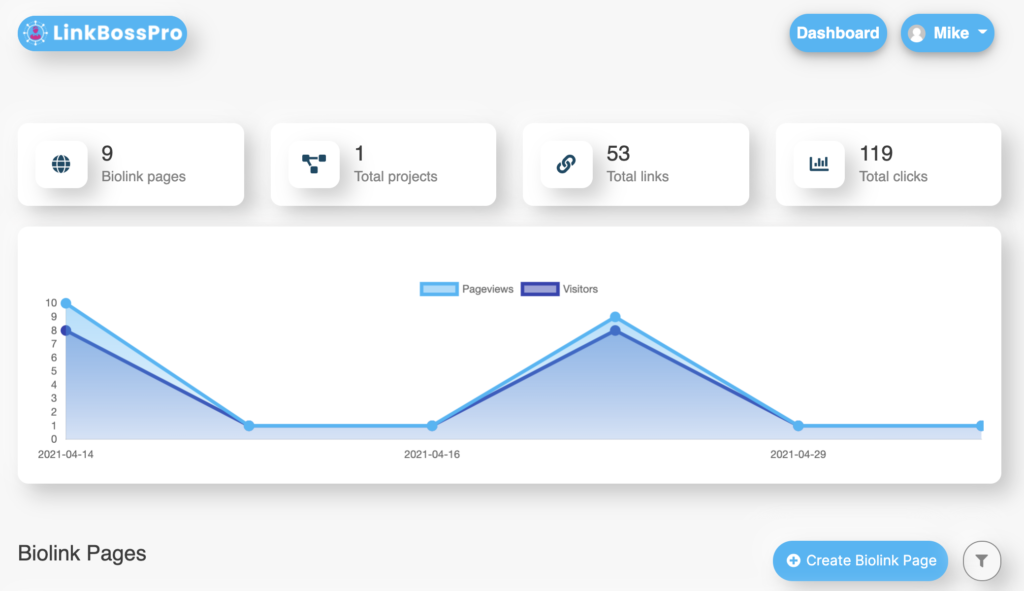
When you login to your account, you will be redirected to your dashboard which displays your overall page analytics for your content as per the image below.
This View will show you the overall links you have created across all your pages as well as the total clicks on these links.
Below the summary total, there is a breakdown per day that details the total traffic to your page (page views) as well as the total number of visitors per day.
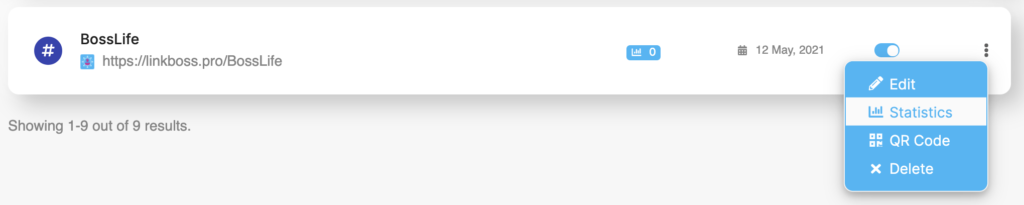
To view the page analytics for a specific Biolink page that you have created, click on the 3 dots on the right-hand side of the link’s box on the dashboard page and then select “statistics” (see image below).
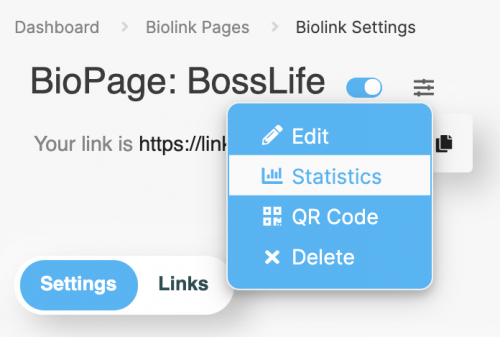
You can also access the statistics for a specific link from the Biolink page settings by clicking on the 3 bars and then “Statistics”.
With either choice, you will now be able to view detailed page analytics for the performance of the links you have curated.
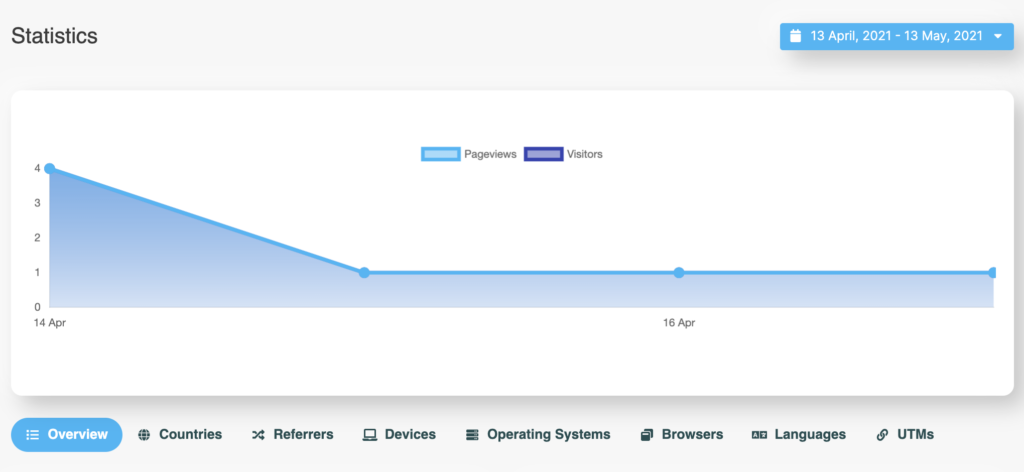
The top of the Biolink statistics page shows you an overview for the specific Biolink page. There is a breakdown per day that details the total traffic to your page (page views) as well as the total number of visitors per day.
Below this you will find a detailed breakdown of the page analytics for your Biolink page.
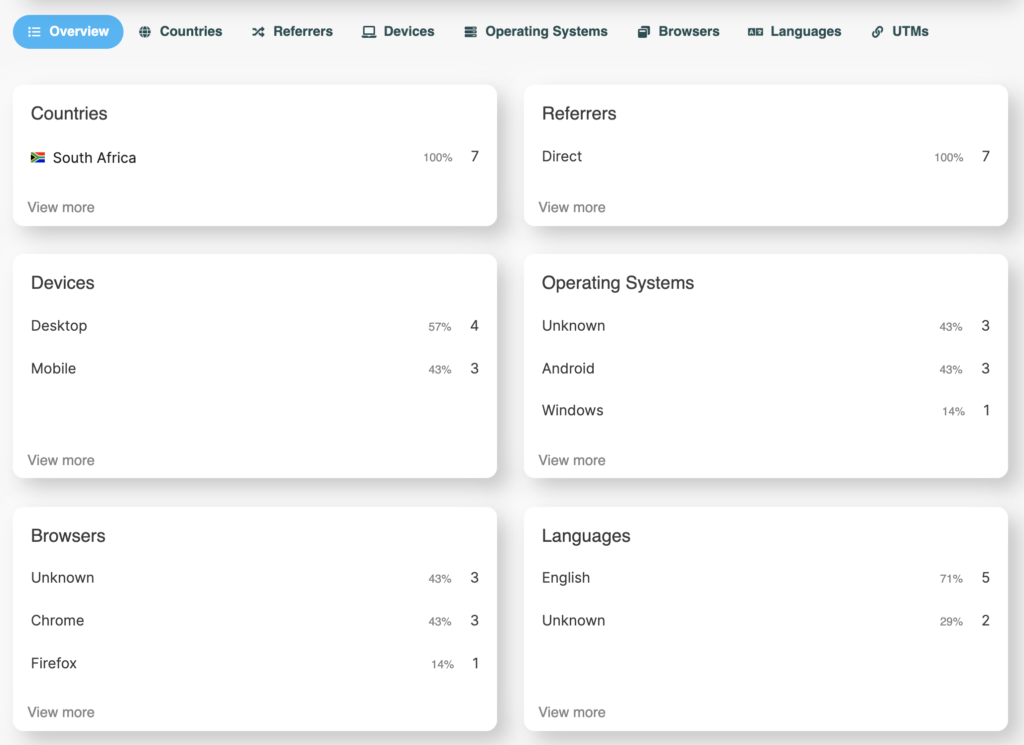
Here you can see data for the countries of your users, top referrers to your page, devices your users were using, the browser and operating systems on their devices.
If you added UTM parameters, you will see the data here.
By clicking on each tab, you can see the specific breakdown for each data point that you want to unpack.
Still, need help?
If you have any additional questions about page analytics or any other questions, please contact the LinkBossPro customer support team in the chat (blue icon in the bottom right corner) or check out more articles here in our blog or check our Youtube channel.
Alternatively you can email our support team via support@linkboss.pro
We use cookies on our website to give you the most relevant experience by remembering your preferences and repeat visits. By clicking “Accept”, you consent to the use of ALL the cookies.
This website uses cookies to improve your experience while you navigate through the website. Out of these, the cookies that are categorized as necessary are stored on your browser as they are essential for the working of basic functionalities of the website. We also use third-party cookies that help us analyze and understand how you use this website. These cookies will be stored in your browser only with your consent. You also have the option to opt-out of these cookies. But opting out of some of these cookies may affect your browsing experience.
Necessary cookies are absolutely essential for the website to function properly. This category only includes cookies that ensures basic functionalities and security features of the website. These cookies do not store any personal information.
Any cookies that may not be particularly necessary for the website to function and is used specifically to collect user personal data via analytics, ads, other embedded contents are termed as non-necessary cookies. It is mandatory to procure user consent prior to running these cookies on your website.